


Churn Analysis: Uncovering the Root Causes of Customer Attrition


Why are customers leaving and what can you do about it? Churn analysis helps answer these questions by revealing the underlying causes of customer churn.
No business is immune to churn, but it doesn’t have to be a guessing game. With the right data and the right analysis, you can pinpoint the core reasons customers leave and take proactive measures to improve customer retention.
What is churn analysis?
Churn analysis is a critical process to help businesses understand why customers abandon a particular product or service. It involves collecting and examining customer data to identify patterns and factors that contribute to customer attrition.

As part of a comprehensive churn management program, churn analysis enables companies to:
Identify loyal and high-value customers
Segment customers based on churn likelihood
Tailor marketing efforts and retention strategies
Improve overall customer retention rates
At its most basic level, churn analysis can look at high level averages—customer churn and revenue churn—over time.
But digging deeper, churn analysis involves discovering the underlying causes behind the numbers, leading to solutions.
First, we’ll look at high-level measures of churn. Then we’ll dig into the nitty-gritty of churn analysis.
Why is churn analysis important?
With the insights gleaned from churn analysis, businesses can take action to reduce churn rates, improve customer satisfaction, and drive long-term growth and profitability.
Here are the key reasons why churn analysis is important:
Retain customers and increase revenue - Customer churn can lead to significant revenue losses. By analyzing churn, businesses can identify areas to improve and reduce the likelihood of customers canceling their subscriptions.
Informed decisions - Churn analysis provides valuable insights into customer behavior, helping businesses make data-driven decisions about product development, pricing and marketing.
Early detection - By tracking churn rates and analyzing customer behavior, businesses can identify and address potential issues early on, preventing small problems from escalating into major problems.
Data-driven improvement - Churn analysis enables businesses to measure the effectiveness of their retention strategies and make adjustments as needed, leading to continued improvement.
Identify at-risk accounts - By analyzing customer behavior and identifying patterns, businesses can proactively target at-risk customers with personalized interventions, reducing the likelihood of churn and improving overall customer satisfaction.
Measuring churn
Churn rate is one of the most important metrics for any subscription business, whether a SaaS (Software as a Service), content or box subscription service. It also impacts other key metrics like lifetime value (LTV) and is vital to understanding growth.
Analyzing churn can start at a high level with churn rates and then be broken down into various categories:
Customer churn and revenue churn
Voluntary and involuntary churn
Churn by cohorts and segments
Let’s look at each of these in more detail.
Customer churn and revenue churn rates
Two key churn metrics give you an overview of your churn:
Customer churn rate - The percentage of customers who cancel during a given period.
Revenue churn rate - The percentage of MRR lost during a given period due to cancellations.
These metrics give you an overview of both customers and revenue lost to churn. Additionally, comparing customer churn and revenue churn rates can help point out possible causes, especially if there’s significant variation between the two. For example, if your monthly customer churn is 5% and revenue churn is 2% over the same period, it means smaller accounts are churning at a higher rate.
These metrics are easy to calculate, or look for them in your subscription billing platform (e.g. Stripe, Chargebee, etc) or third-party analytics (e.g. Baremetrics).
Voluntary and involuntary churn rates
Churn rate can also be divided into whether it is active or passive:
Voluntary churn, also referred to as active churn, happens when a customer makes a conscious decision to stop paying for your product or service. They call, email or complete your cancellation flow. This kind of churn is typically the result of fundamental issues in your product, e.g. buggy software or poor product-market fit.
Involuntary churn, also known as passive churn, happens when a subscription renewal fails due to payment issues. Cards expire, get lost, stolen and so on. The customer didn’t actively choose to cancel and may not know of the payment failure.
On average, delinquent credit cards make up 20-40% of overall churn. Dunning is the methodical process of communicating with customers to resolve these failed payments and resume subscriptions. Dunning software can automate this process via email, producing immediate results.
Churn rate by segment and cohort
Tracking your overall churn rates is essential, but averages can be deceiving. If you have tiered pricing or serve different types of customers, the churn rate between these could vary dramatically. With a single number, you might not be able to see what’s really going on.

For example, suppose your company has a particular customer segment with much higher churn than the others. If that segment experiences rapid growth relative to the others, it will cause overall churn to increase. On the surface this looks alarming (churn is going up), but in reality it’s just a shift in the relative proportions of your user base. (Of course, it also highlights the need to address churn in that specific segment, where there is probably a lack of product-market fit.)
One way to see these differences is to track churn rate by customer segment. Segmentation is a way to group customers by common attributes, such as plan, industry, MRR, etc. You can also group customers into time-based cohorts—for example, by the month in which they signed up—to spotlight changes in churn associated with events like pricing changes, feature releases, seasonal trends and promotions.


Churn analysis in depth
Once you have an understanding of your churn rate, it’s time to dive into analysis and discover the primary causes of churn.
Churn analysis focuses primarily on discovering the causes of voluntary churn. Most of your customers won’t hand you a detailed explanation of why they are going, but they do leave behind a trail of clues (e.g. customer support tickets, product usage patterns, social media mentions and survey responses).
The goal of churn analysis, then, is to sift through this data to discern:
commonalities in customers who cancel
significant differences between those who stay and those who cancel
Your analysis can answer questions like:
Are users not making it through onboarding or failing to reach other milestones?
Are customers more likely to churn during certain windows of time?
Is there seasonality with cancellations?
What are early indicators that a customer is considering cancellation?
Are certain customer segments more likely to cancel?
Have specific events (e.g. a price hike) led to changes in churn rate?
Preparing for analysis
You’ll want to collect data from as many of these sources as you have available:
Subscription billing data
Customer satisfaction surveys
Exit interviews and churn surveys
Behavioral analytics
Customer support tickets
Mentions on social media and review sites
Competitive analysis
Usability studies
Begin with whatever data you have available. As you learn more about your churn, you may want to invest in collecting more types of data to fill gaps.
Let’s see how each data source contributes to analysis:
Subscription billing data
Data from your billing platform can be useful in your churn analysis, helping you answer questions like:
Are there identifiable points when churn is higher?
How does customer churn differ between pricing plans/tiers?
Seasonality - is churn related to regular events like tax day or EOY?
High level churn analytics (such as customer and revenue churn rates, as described above) are provided by most subscription billing platforms. There may also be options to break down churn data by customer attributes, e.g. plan and subscription age.
Third-party analytics like Baremetrics allow you to go deeper with segmentation and time-based cohorts, which can provide greater clarity than simple high-level averages.
Customer satisfaction surveys
Regularly collecting feedback through the customer lifecycle can aid your churn analysis, helping teams understand user behavior and expectations, identify triggers of dissatisfaction, and surface at-risk accounts.
Keep surveys short (a single question or NPS is ideal) and in context. In-app “microsurveys” get much higher response rates than longer surveys. You can always follow up directly with customers for more in-depth feedback, or combine survey responses with other data sources to discover patterns associated with low customer satisfaction.
Exit interviews and churn surveys
Engaging with customers who’ve canceled gives you the most direct answers to why they leave.
For most businesses, a subscription cancellation flow is the ideal place to conduct churn surveys. Collecting feedback before cancellation will garner much more data than post-cancellation, plus it allows you to target retention offers based on cancellation reasons.
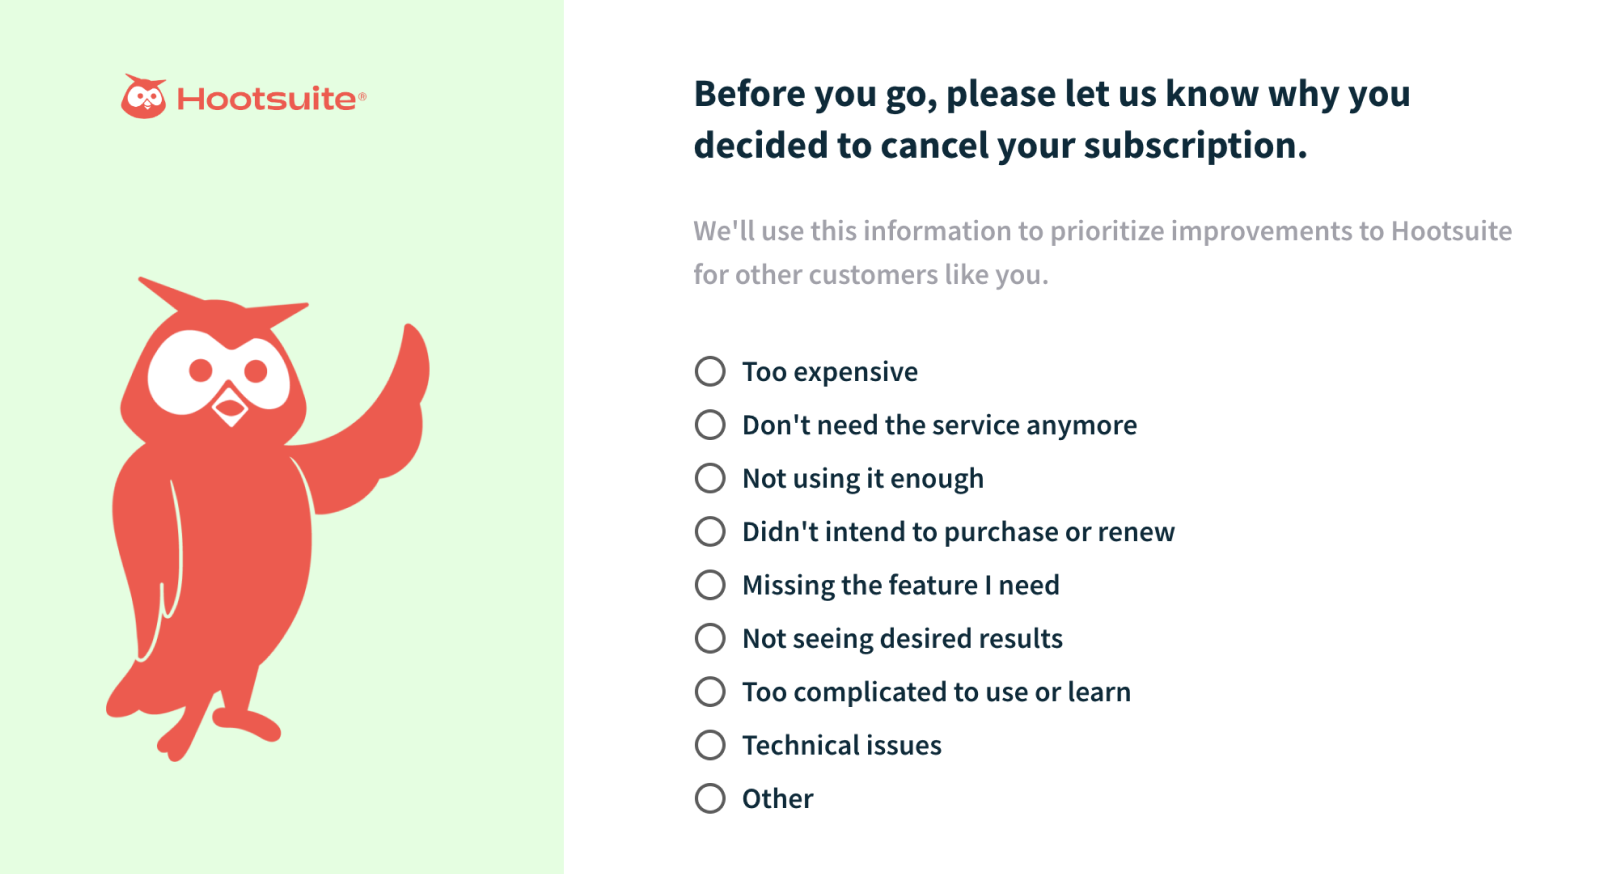
The questions you ask depend on your business, but we recommend most services ask two basic questions:
a multiple choice question that captures the customer’s primary reason for leaving
an open-ended question asking for additional feedback
The first question should be multiple choice to make it easy for customers to answer and easily reported on in aggregate. Include the most common reasons for cancellation, such as price, service, leaving for a competitor, lack of certain features and so on.
When asking for additional feedback, use a multi-line text box to convey to the customer that you’re looking for as much feedback as they’re willing to provide and not just two-word answers. If you start seeing recurring feedback in the open-ended field, consider adding it to your predefined list above.
Data from churn surveys reveals the top drivers of cancellation, and regular review can reveal trends over time. Hosted cancellation flow software can also easily correlate lost MRR to cancellation reasons, helping prioritize interventions by ROI.

Alternatively, following up by phone or email after cancellation can start meaningful conversations. For smaller businesses, this would ideally be from a founder. Keep it simple and authentic. While the response rate will be lower, you’ll get more genuine feedback.
Behavioral analytics
Behavior analytics tools like Mixpanel track your customers’ in-app behavior and turn the raw data (clicks, form submissions, etc) into a timeline of comprehensible events. When analyzed in aggregate, this information can identify where customers get stuck, leading to churn.
Support tickets
Customers who cancel may leave behind a history of support interactions. Scrutinize this correspondence to identify patterns, which can reveal shortcomings at the root of churn.
Mentions on social media and review sites
Negative ratings or complaints on social media or review sites offer clues to the causes of churn. Reach out to customers to address legitimate issues, and keep track of recurring themes.
Competitive analysis
Sometimes churn is driven by changes in the competitive landscape. If you notice churn increasing, doing a survey of your market competition may reveal a disruptive new competitor or lower prices. This is another place your churn survey can help by highlighting the top competitors enticing away your customers.
Usability studies
Conducting usability studies can reveal hiccups in the customer journey that result in churn. Once rough spots are identified, these can be addressed with UX redesigns,

and support materials.
Overwhelmed by the problem of customer churn? For busy teams, outsourcing churn management to a third-party consultant or agency can fill gaps in expertise, while saving time and money.
For example, a fractional CCO (Chief Customer Officer) can provide customer-centric leadership on a part-time basis at significantly reduced cost.
Making a plan
Of course, the goal of churn analysis isn’t just to understand churn. Armed with the insights gleaned from your analysis, it’s time to develop and implement strategies to reduce it.
These may include:
Improving customer service to resolve issues quicker or anticipate customer needs
Responding to the most-needed features on your roadmap
Offering discounts or loyalty programs
Predict at-risk customers - Use machine-learning models to predict which customers may churn in the future and reach out to them
Common causes of churn
While every business is unique, there are a few drivers of churn that occur frequently. These can be categorized as failures in five areas:
Product-market fit - When your value proposition doesn’t meet customer needs, they’ll go somewhere else. Identifying key feature gaps allows you to adjust your roadmap accordingly.
Product adoption - Are customers discovering your product’s utility and making it part of their work and life?
Customer experience - Bugs, downtime, usability problems and other frustrations are a big driver of customer dissatisfaction.
Customer support - Are you addressing customer problems in a timely manner?
Pricing - Churn can result from price increases, a lower-cost competitor entering the marketplace, or economic conditions that reduce customer willingness to pay. If price is a common complaint, you might consider adjusting your tiers or offering discounts to sensitive customers. If you rarely lose customers due to price, perhaps you’re not charging enough!
Winback campaigns
You know which customers have churned. You now know the reasons why. Use this information to intelligently remarket to lost customers with the goal of recapturing the revenue lost when they churned. If it was due to a feature that you now have, pull up a list of those customers and let them know you now have it and entice them back. If it was purely a pricing decision, consider offering them a discount, whether permanent or temporary to continue using your services.

Conclusion
Understanding and addressing customer churn is vital for the long-term success and profitability of any subscription-based business.
Comprehensive churn analysis, as part of an overall churn management program, can help businesses identify the reasons behind customer attrition and take proactive steps to reduce it, such as improving product-market fit, enhancing customer experience and optimizing pricing strategies. Additionally, implementing effective win-back campaigns can help recover lost revenue and rebuild customer relationships.
By prioritizing churn analysis and taking data-driven actions, businesses can foster customer loyalty, increase retention rates and ultimately drive long-term growth.
With ProsperStack Retain, you can start collecting valuable insights and reduce churn, practically overnight. Our user-friendly software consistently helps high-volume subscription brands improve customer retention by 10 to 39% at the point of cancellation. Get a demo.


