


Churn Management: Step by Step


Churn management is the business process of identifying why subscribers cancel and deploying strategies to retain more of them.
Every subscription-based business faces customer attrition, but the primary causes differ from product to product. Successful churn management involves data collection and analysis to discover the top sources of churn in your business and then find ways to correct those deficiencies.
An overview of the process looks like this:
Measure and track your churn - You need to know your churn now and over time to gauge the effectiveness of your customer retention initiatives.
Collect data and analyze for causes of cancellation - Assemble customer data from subscription billing platforms, CRM/CDPs, in-app analytics, churn surveys, etc. Look for patterns in customer feedback and behavior to identify the key drivers of churn in your business.
Create an action plan - Based on the analysis above, brainstorm solutions to address the most common causes of churn. Prioritize the highest-value interventions.
Test and repeat - Put your ideas into action, measure results and continue to make improvements.
Let’s take a closer look at each.
Looking to reduce churn fast? An automated cancellation flow from ProsperStack can start working in days, not months.
Embedded with just a few lines of code, ProsperStack Retain collects exit feedback and prevents 10-39% of churn with targeted offers and deflections. Iterate quickly, A/B test interventions and surface actionable insights to maximize retained revenue.
Learn more about Retain or get a demo.
1. Measure and track your churn
It’s kind of obvious. You need to measure your churn so you can know if your efforts to reduce it are having a positive impact.
There are two key churn metrics you should track:
Churn rate - The percentage of customers who cancel during a given period.
Revenue churn rate - The percentage of MRR lost during a given period due to customer cancellations.
These churn metrics are easy to calculate, or you can find them in your subscription billing platform (e.g. Stripe, Chargebee, etc) or third-party analytics (e.g. Baremetrics).
In addition, comparing these two metrics can help point you in the direction of possible causes, particularly if there’s significant variation between the two. For example, if your monthly customer churn is 5% and revenue churn is 2% over the same period, you know it’s the smaller accounts that churn at a higher rate.
Churn rate by segment and cohort
Knowing your overall customer and revenue churn rates is essential, but averages can be deceiving. If you have tiered pricing or serve different industries, the churn rate between these could vary drastically. Looking at a single number might obscure what’s really going on.

For example, suppose your company has a particular customer segment with much higher churn than the others. If that segment experiences rapid growth relative to the others, it will cause overall churn to increase. On the surface this looks alarming (churn is going up), but in reality it’s just a shift in the relative proportions of your user base.
One way to see these differences is to track churn rate by customer segment. Segmentation is a way to group customers by common attributes, such as plan, industry, MRR, etc. You can also group customers into time-based cohorts—for example, by the month in which they signed up—to spotlight changes in churn associated with events like pricing changes, feature releases, seasonal trends and promotions.


Churn rate by type (voluntary and involuntary)
You can also divide your churn rate by the two major types:
Voluntary churn, also called active churn, happens when a customer makes a conscious decision to stop paying for your product or service. They call, email or go through your cancellation funnel. This kind of churn often reflects fundamental issues in your product, such as buggy software or poor support.
Involuntary churn, also known as passive churn, happens when a subscription renewal fails due to credit card expiration, lack of funds or other payment issues. The customer didn’t choose to cancel and may be unaware of the failure.

2. Analyze customer data to discover the primary causes of churn
Once you have an understanding of your churn rate, it’s time to dive into analysis.
Churn analysis focuses primarily on discovering the causes of voluntary churn. Most of your customers won’t offer up a detailed explanation of why they cancel, but they do leave a trail of clues (e.g. customer support tickets, product usage patterns, social media mentions and survey responses).
The goal of churn analysis, then, is to sift through this data to discern:
commonalities in customers who cancel
significant differences between those who stay and those who cancel
Your analysis can answer questions like:
Are users not making it through onboarding or failing to reach other milestones?
Are customers more likely to churn during certain windows of time?
Is there seasonality with cancellations?
What are early indicators that a customer is considering cancellation?
Are certain customer segments more likely to cancel?
Have specific events (e.g. a price hike) led to changes in churn rate?
Preparing for analysis
You’ll want to collect data from as many of these sources as you have available:
Subscription billing data
Customer satisfaction surveys
Exit interviews and churn surveys
Behavioral analytics
Customer support tickets
Mentions on social media and review sites
Competitive analysis
Usability studies
Begin with whatever data you have available. As you learn more about your churn, you may want to invest in collecting more types of data to fill gaps.
Let’s see how each data source contributes to analysis:
Subscription billing data
Your subscription billing platform most likely provides high level churn analytics (such as customer and revenue churn rates, as described above). In addition, it may include options to break down churn by customer attributes, e.g. plan and subscription age.
Third-party billing analytics tools like Baremetrics allow you to dig deeper with segmentation and time-based cohorts, which may provide greater clarity than simple high-level averages.
Helping you answer the following questions:
Are there identifiable points when churn is higher?
How does customer churn differ between pricing plans/tiers?
Seasonality - is churn related to regular events like tax day or EOY?
Customer satisfaction surveys
Regularly collecting feedback through the customer lifecycle helps teams understand user behavior and expectations, identify triggers of dissatisfaction, and surface at-risk accounts.
Keep surveys short (a single question or NPS is ideal) and in context. In-app “microsurveys” get much higher response rates than longer surveys. You can always follow up directly with customers for more in-depth feedback, or combine survey responses with other data sources to discover patterns associated with low customer satisfaction.
Exit interviews and churn surveys
Engaging with customers who’ve canceled gives you the most direct answers to why they leave.
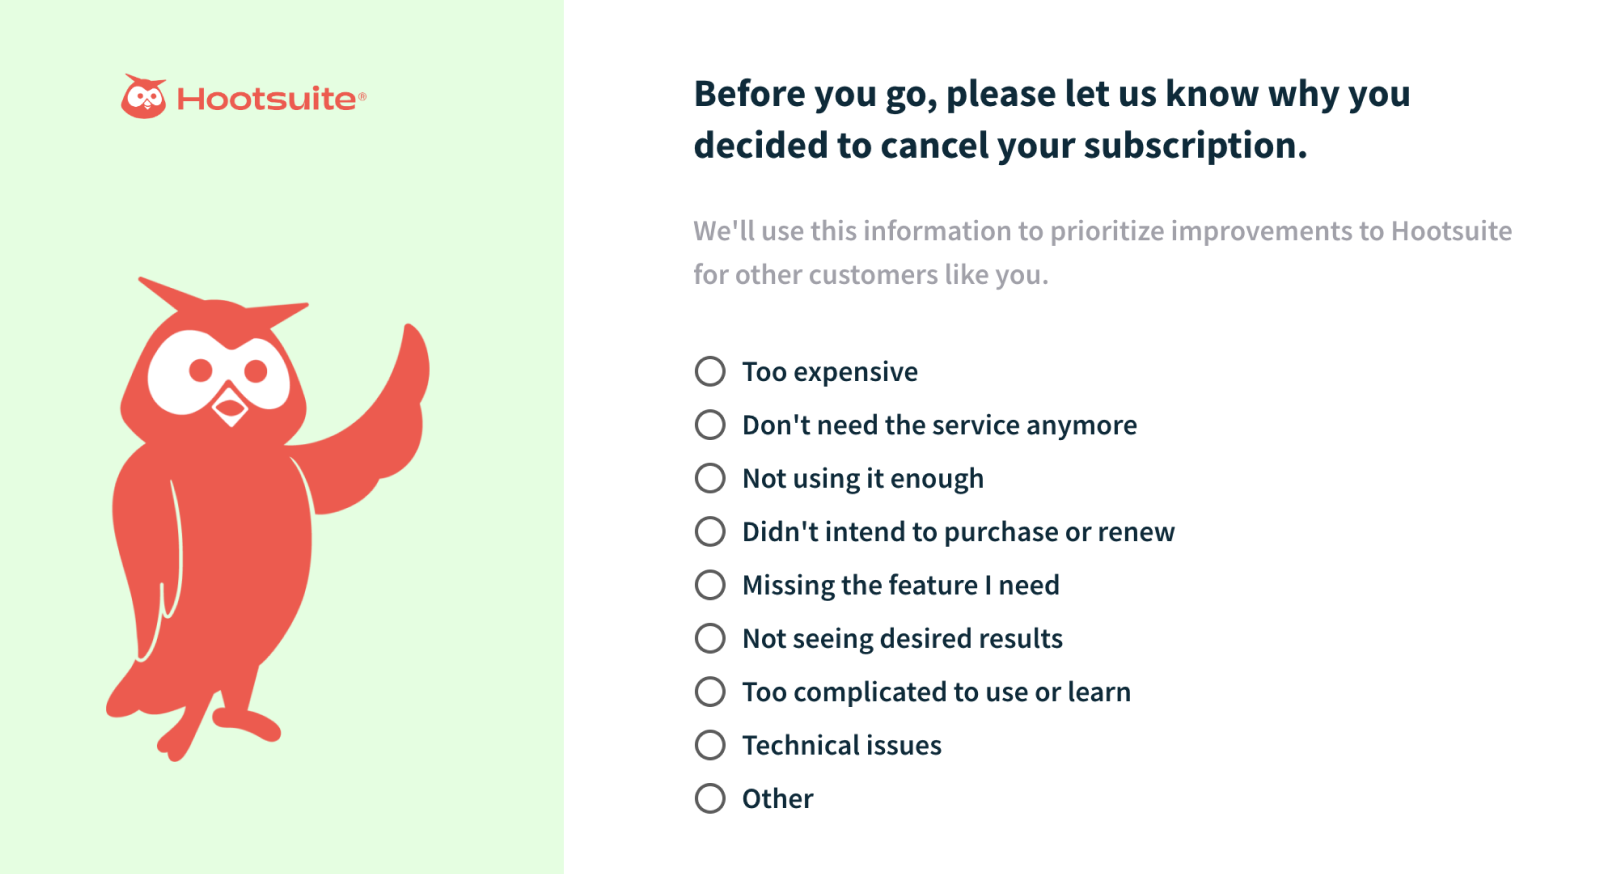
For most businesses, a subscription cancellation flow is the ideal place to conduct churn surveys. Collecting feedback before cancellation will garner much more data than post-cancellation, plus it allows you to target retention offers based on cancellation reasons.
Data from churn surveys reveals the top drivers of cancellation, and regular review can reveal trends over time. Hosted cancellation flow software can also easily correlate lost MRR to cancellation reasons, helping prioritize interventions by ROI.
Alternatively, following up by phone or email after cancellation can start meaningful conversations. For smaller businesses, this would ideally be from a founder. Keep it simple and authentic. While the response rate will be lower, you’ll get more genuine feedback.
Don’t have time to conduct telephone interviews with your customers? Consider hiring a churn management consultant to take on this valuable task.
Behavioral analytics
Behavior analytics tools like Mixpanel track your customers’ in-app behavior and turn the raw data (clicks, form submissions, etc) into a timeline of comprehensible events. When analyzed in aggregate, this information can identify where customers get stuck, leading to churn.
Support tickets
Customers who cancel may leave behind a history of support interactions. Scrutinize this correspondence to identify patterns, which can reveal shortcomings at the root of churn.
Mentions on social media and review sites
Negative ratings or complaints on social media or review sites offer clues to the causes of churn. Reach out to customers to address legitimate issues, and keep track of recurring themes.
Competitive analysis
Sometimes churn is driven by changes in the competitive landscape. If churn is worsening, doing an analysis of your market competition may reveal a disruptive new competitor or lower prices from others. This is another place your exit survey can help by highlighting the top competitors your customers leave for.
Usability studies
Conducting usability studies can reveal hiccups in the customer journey that result in churn. Once rough spots are identified, these can be addressed with UX redesigns, better onboarding and support materials.
Common causes of churn
While every business is unique, there are a few drivers of churn that occur frequently. These can be categorized as failures in five areas:
Product-market fit - When your value proposition doesn’t meet customer needs, they’ll go somewhere else.
Product adoption - Are customers discovering your product’s utility and making it part of their work and life?
Customer experience - Bugs, downtime, usability problems and other frustrations are a big driver of customer dissatisfaction.
Customer support - Are you addressing customer problems in a timely manner?
Pricing - Churn can result from price increases, a lower-cost competitor entering the marketplace, or economic conditions that reduce customer willingness to pay.
3. Create an action plan
With the key drivers of churn identified, it’s time to brainstorm and prioritize solutions.

Prioritizing solutions
There are countless improvements you could make to your product offering, but not all of them will have the same impact on customer retention. Perhaps only a few will have a significant and immediate impact on churn.
With that in mind, you’ll want to prioritize interventions by two basic criteria:
Probable impact on churn - How significant a reduction in churn could this effort produce? Consider not just churn rate, but revenue churn, too. Tools like ProsperStack can correlate lost MRR to cancellation reasons.
Level of effort - Some interventions (like adding a major feature) may take months of effort, while others can be done in a few days, like implementing a cancellation flow with ProsperStack Retain.
Begin with the interventions that will have the highest impact on churn for the lowest expenditure of time and money.
4. Test and repeat
Churn management is a long-term project that requires continual refinement, making testing and measurement critical to success. With each intervention you’ll learn what does or doesn’t work. With a well-executed churn management process, you’ll continue to improve retention over time.
Manage churn with ProsperStack Retain
A cancellation flow is one of the simplest and most cost-effective ways to reduce churn, practically overnight. We’re ProsperStack, the cancellation flow experts, and our user-friendly software consistently helps high-volume subscription-based businesses reduce churn by 10 to 39%.
Learn more or get a demo.


